Additional Modules
Simulating CPMG and CEST Profiles
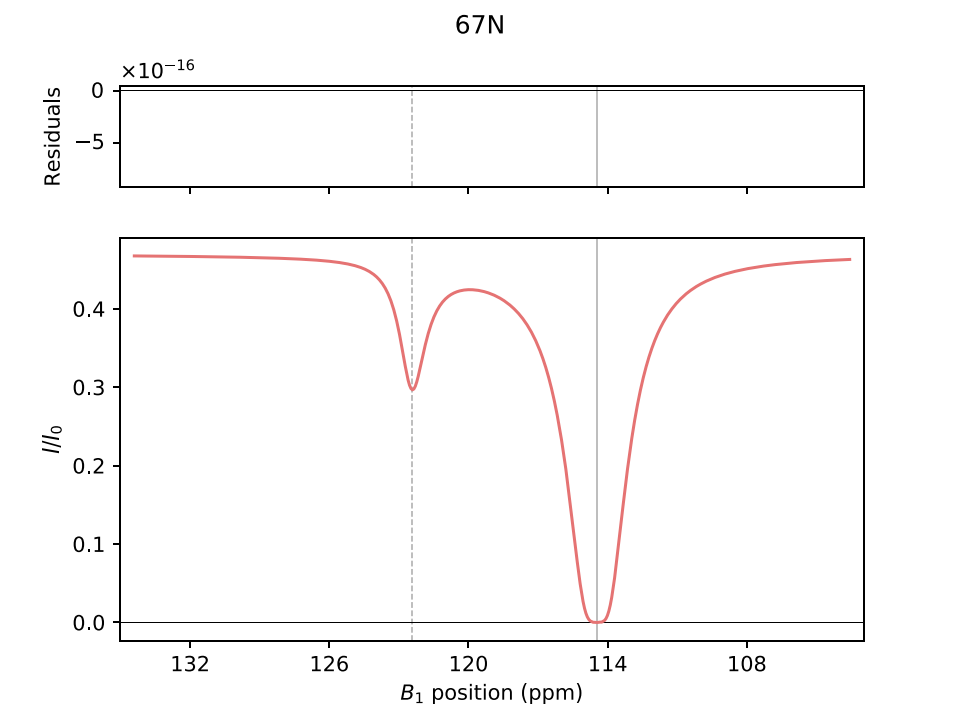
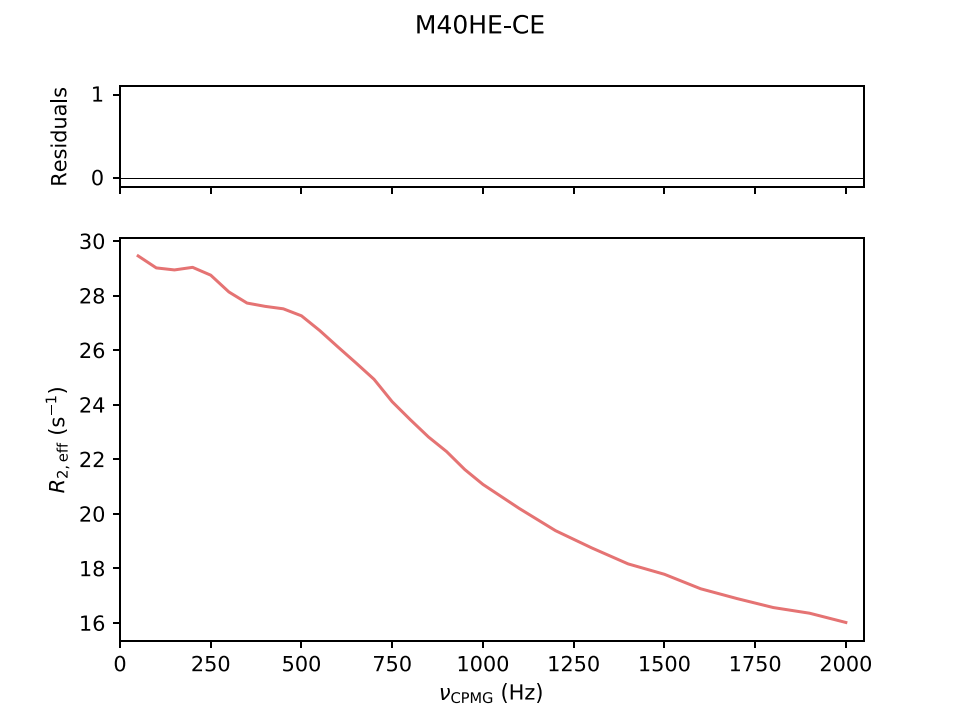
ChemEx enables the simulation of CPMG or CEST profiles based on a specified set of input parameters. These simulations are useful for exploring the impact of each parameter on the results.
To run a simulation in ChemEx, use the following command:
chemex simulate -e <FILE> \
                -p <FILE> \
                -d <MODEL> \
                -o <DIR>
Example simulation results for CPMG and CEST experiments are shown below:
Options
| Option | Description |
|---|---|
-e, --experiments | Specifies the files containing experimental setup and data location |
-p, --parameters | Specifies the files containing the initial parameter values |
-d, --model | Specifies the exchange model used for simulation (default: 2st) |
-o, --output | Specifies the output directory (default: ./Output) |
--plot {nothing,normal} | Sets the plotting level (default: normal) |
--include | Residues to include in the simulation (optional) |
--exclude | Residues to exclude from the simulation (optional) |
Example
An example script for running simulations can be found here in the simulate.sh file.
Plotting Best-Fit Parameters
The plot_param module in ChemEx allows you to visualize fitting results interactively.
Options
| Option | Description |
|---|---|
-p, --parameters | Specifies the files containing fitted parameters for plotting |
-n, --parname | Specifies the name of the parameter to plot |
Example
An example of using this module is available in the protein-ligand binding example. After running run.sh, display the chemical shift differences between free and bound states with:
chemex plot_param -p Output/STEP2/All/Parameters/fitted.toml -n DW_AB
To compare the transverse relaxation rates of both states, use:
chemex plot_param -p Output/STEP2/All/Parameters/fitted.toml -n R2
These commands are also included in the plot_param.sh script in this example. By analyzing these parameters, the core interaction site can be identified, along with a tail at the C-terminal end displaying increased R2 rates and minimal chemical shift changes. This tail may indicate transient interactions with the binding partner, causing steric restrictions in that region.
Initial Estimates of Δϖ for CEST Experiments
In CEST (and D-CEST/COS-CEST) experiments, choosing appropriate initial values for Δϖ is crucial to avoid local minima in fitting. The pick_cest module in ChemEx facilitates manual selection of major and minor dips in CEST profiles, which correspond to the ground and excited states.
Use the following command to launch the pick_cest module:
chemex pick_cest -e <FILE> -o <DIR>
Upon running this command, a window displaying all CEST profiles will appear. For each profile, click first on the major dip, then on the minor dip(s). If only one dip is visible (indicating the minor dip overlaps with the major dip), click the major dip twice. Use the Next and Previous buttons to navigate profiles, Swap to switch between major and minor states, and Clear to reset selections on the current profile. During this process, two files are generated in real-time: cs_a.toml (chemical shifts of the major state) and dw_ab.toml (chemical shift differences between major and minor states).
Example
Scripts to try out this module are provided in the pick_cest.sh file under the CEST_15N example and pick_dcest.sh file under the DCEST_15N example for CEST and D-CEST experiments, respectively.